Physical Address
304 North Cardinal St.
Dorchester Center, MA 02124
Physical Address
304 North Cardinal St.
Dorchester Center, MA 02124

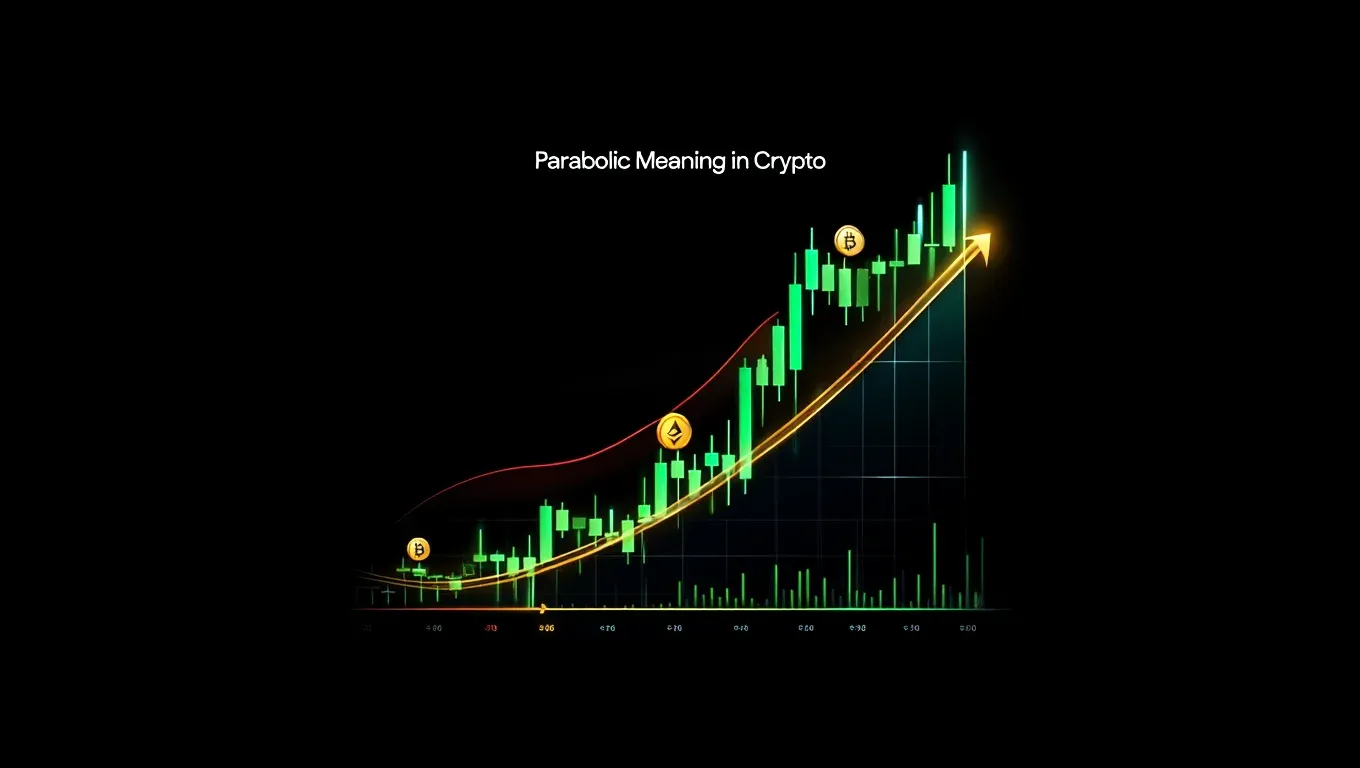
To say a cryptocurrency is “going parabolic” means its price is surging upward at an accelerating rate, forming a steep, almost vertical chart pattern. This phenomenon, common in volatile markets like crypto, is key for both short-term traders and long-term investors to understand because parabolic moves can bring opportunities as well as significant risks.
Parabolic price action drives strong emotions excitement and anxiety alike impacting everything from FOMO-fueled buying frenzy to abrupt market reversals. By the end of this article, you’ll know how to spot these patterns, what they mean, and how to respond wisely.
In crypto, a parabolic move is when a coin or token’s price rapidly accelerates, rising faster and faster in a short time, typically ending with a steep “blow-off” top. Unlike gradual bull runs, these moves snowball as traders and investors pile in.
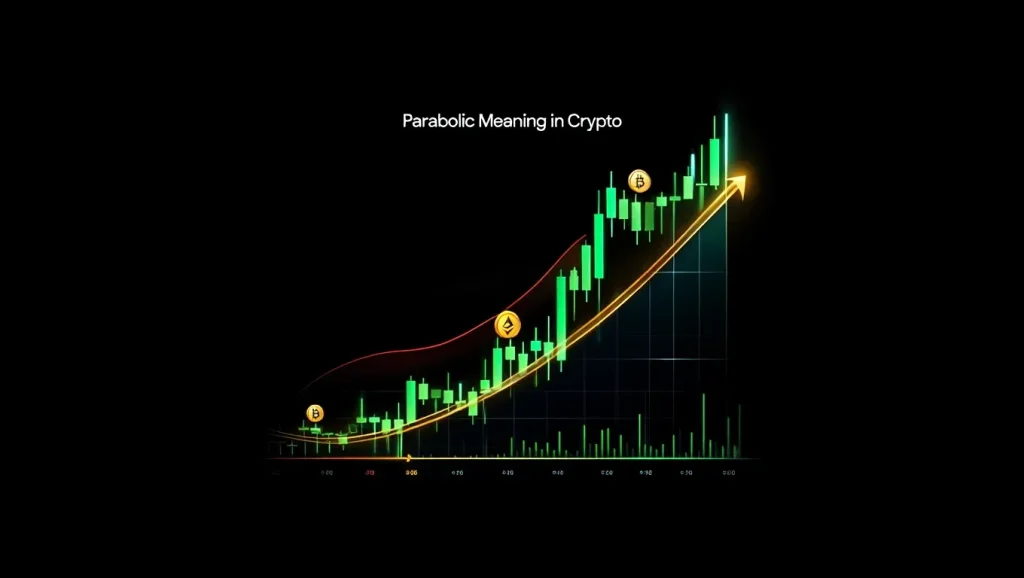
Visually, a parabolic move looks like a hockey stick on price charts flat at first, then curving sharply up. The name comes from the mathematical “parabola” shape (y = x²) you might recall from algebra. Imagine a rocket launching: the chart starts steady, then bends upward steeper and steeper until it’s almost vertical.
In formal math, a “parabola” is a symmetrical U-shaped curve defined by an equation. In crypto, “parabolic” is borrowed to describe the visual similarity, but there’s no precise mathematical formula in play just an extreme, accelerating move. The point is rapid escalation, not perfect geometric accuracy.
Understanding this distinction helps avoid confusion with technical terms, especially as we move into deeper analysis and real-life trading use cases.
| Pattern | Price Movement | Duration | Risk |
|---|---|---|---|
| Linear | Steady, straight upward/downward | Longer | Lower |
| Exponential | Increasing speed, often doubles at set intervals | Medium | Moderate |
| Parabolic | Accelerates rapidly; curve becomes nearly vertical | Short | Very High |
A true parabolic run is much steeper than the others. On TradingView—or your favorite charting tool—always check slope, trading volume, and the speed of price movement for clear signals.

Cryptocurrency markets are naturally volatile and globally accessible 24/7. Parabolic moves often start because:
Crowd psychology plays a huge role. As excitement spreads on social media, more people buy, causing self-reinforcing upward spirals—classic herd behavior. Positive feedback loops are amplified by influencers and instant news.
Not every fast rise means a bubble, but parabolic spikes are often a sign that enthusiasm has outpaced real value.
Bitcoin soared from under $1,000 in early 2017 to nearly $20,000 by December—a more than 1,800% increase in less than a year. Volume exploded, media attention peaked, and everyday investors piled in. This textbook parabolic move ended in a sharp correction in 2018.
Dogecoin, originally a meme, ran from less than $0.01 to $0.74 in just five months (a 7,400% gain), mostly on viral social media momentum and celebrity endorsements. Its chart during that time looked like a hockey stick—near-vertical before crashing back to earth.
| Asset | Start Price | Peak Price | % Gain | Time to Peak |
|---|---|---|---|---|
| Bitcoin | $1,000 | $19,800 | 1,880% | 1 year |
| Dogecoin | $0.007 | $0.74 | 7,400% | 5 months |
| Solana | $1.5 | $250 | 16,500% | 10 months |
These moves were unforgettable for those involved—many fortunes were made and lost.
Related reads to deepen your knowledge:
Parabolic uptrends often end with a “blow-off top”—a dramatic reversal where prices drop even faster than they climbed. This can mean a 40–90% loss from the peak, sometimes in days or weeks.
| Asset | Peak Price | Post-Parabola Low | % Drop | Time to Low |
|---|---|---|---|---|
| Bitcoin | $19,800 | $3,200 | 84% | 1 year |
| Dogecoin | $0.74 | $0.12 | 84% | 6 months |
These rapid turns trigger intense emotions. Traders ride a wave of euphoria—then despair—as gains evaporate. Social media sentiment swings from “to the moon!” to “crypto is dead” in a blink. It’s a powerful reminder to be cautious during extremes.
| Tool/Indicator | What It Does | How to Use |
|---|---|---|
| Parabolic SAR | Signals potential trend reversals | Place on chart to spot trend exhaustion |
| Stop-Loss | Auto-sells when prices fall to your safety limit | Set below local supports or after sharp jumps |
| Volume | Shows trading momentum/sentiment | Monitor for spikes/disproportionate surges |
The Parabolic SAR (Stop and Reverse) is a popular momentum technical indicator that helps traders spot likely trend reversals on charts. On most trading platforms, it appears as a series of dots above or below price bars.
Don’t confuse “parabolic move” (a chart pattern) with Parabolic SAR (an indicator tool). The former refers to rapid price increases; the latter is designed to tell you when a trend may be stopping or changing direction.
Beginners should test Parabolic SAR on demo accounts and only rely on it after understanding its quirks—especially in markets where volatility is the norm.
Q: Are all bull runs parabolic in crypto?
A: No. Many healthy uptrends are steady and gradual. Parabolic runs are defined by their extreme, unsustainable pace and near-vertical charts.
Q: Is “Parabolic” a crypto coin or project?
A: Sometimes, new tokens or projects are named “Parabolic,” but the term is mostly used to describe extreme market moves rather than any single coin.
| Question | Short Answer |
|---|---|
| Are parabolic rallies always bubbles? | Not always, but most end with sharp corrections. |
| Can small tokens experience parabolic moves? | Yes. Low-cap assets are more prone due to volatility and low liquidity. |
| Should I “buy the dip” after a parabolic collapse? | Depends—some recover, many don’t. Study the fundamentals before acting. |
Confusion between chart patterns, technical indicators, and coin names is very common—when in doubt, always check context.
| Definition | Chart Pattern | Causes | Risk | Trading Response |
|---|---|---|---|---|
| Ultra-rapid, accelerating price surge | Near-vertical “hockey stick” on chart | Speculation, FOMO, news, crowd psychology | Extreme; prone to sharp reversals | Take profits, use stop-losses, monitor volume/warning signs |
Parabolic moves are among the most dramatic and risky events in crypto trading. By learning how to spot a parabolic trend, understanding the psychology behind these moves, and applying intelligent strategies, you can better navigate both the opportunities and dangers ahead. While chasing “to the moon” gains is tempting, history shows that parabolic rallies are often fleeting, and caution, education, and risk management are always essential especially as the crypto market matures in 2025 and beyond.
At Webtaichinh, our mission is to provide you with clear, unbiased insights into the world of cryptocurrency through the Cryptocurrency category, helping you navigate complex topics with confidence, without hype or hidden agendas.
Webtaichinh delivers real-time financial updates, ensuring you stay informed about market trends, policies, and global economic developments. As part of our commitment to excellence, we provide accurate information and in-depth analysis, empowering investors to make swift, confident decisions in a dynamic financial world.
For inquiries or personalized assistance, feel free to contact us:
📞 Phone: 055 937 9204
📧 Email: webtaichinh@gmail.com
💻 Website: https://webtaichinh.vn/
📍 Address: 13 Ho Tung Mau, An Binh, Di An, Binh Duong
At webtaichinh, your financial success is our mission.