Physical Address
304 North Cardinal St.
Dorchester Center, MA 02124
Physical Address
304 North Cardinal St.
Dorchester Center, MA 02124
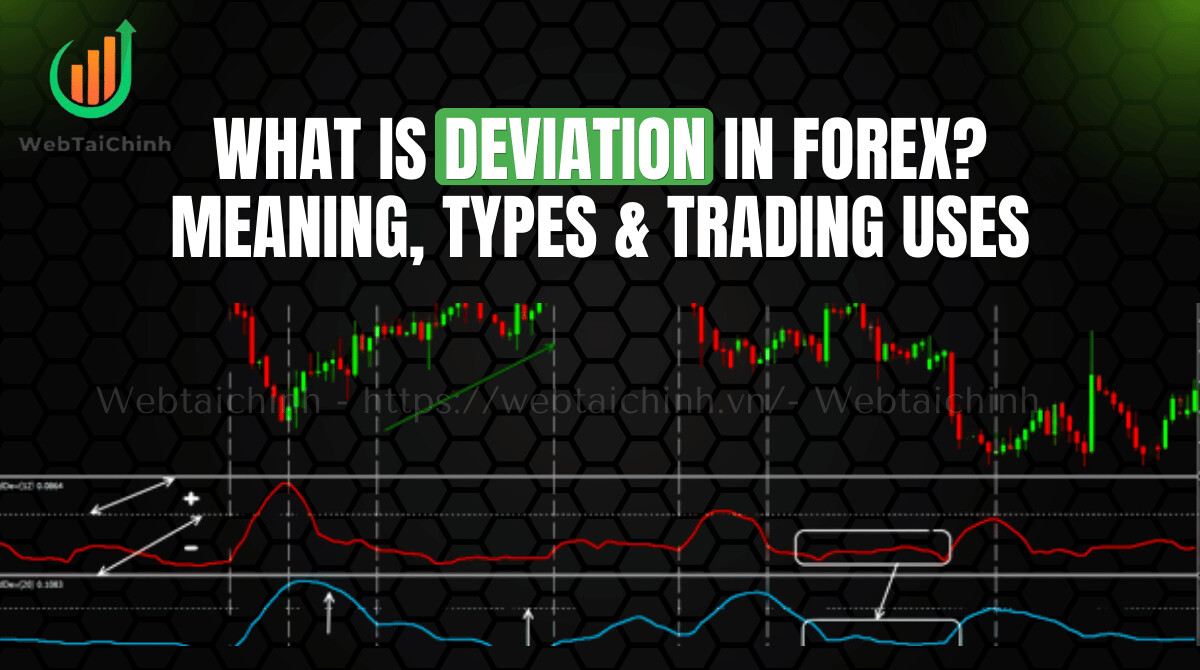
What is deviation in forex and why does it matter for traders? Deviation in forex is the measure of how far a currency pair’s price moves away from an expected or average value, and it plays a critical role in understanding volatility, refining entries and exits, and managing risk. Many traders struggle with sudden price swings, failed entries, or unexpected slippage all of which are linked to deviation. By mastering this concept, you gain an edge in spotting overextended moves, anticipating reversals, and adapting strategies to changing market conditions.
At Webtaichinh, we break down complex forex concepts like deviation into clear, actionable insights to help you trade with more confidence and precision.
Key takeaways:
Deviation in forex trading refers to the difference between the actual market price of a currency pair and its expected or average value. In simple terms, it measures how far the price strays from a reference point, such as a moving average or forecasted level. This makes deviation one of the most important tools to understand price volatility and execution quality.
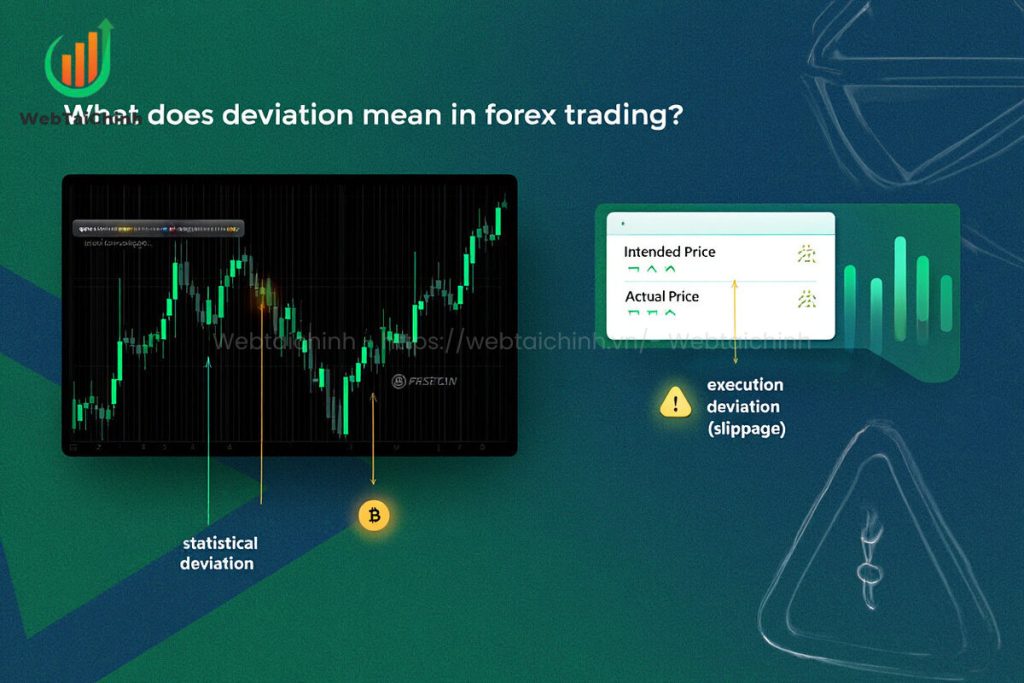
There are two main contexts where traders encounter deviation:
Statistical deviation: Shows how much price fluctuates around its mean. For example, when EUR/USD moves far away from its 20-period moving average, the deviation highlights the level of volatility.
Execution deviation (slippage): Refers to the price difference between the level you intended to trade at and the actual fill. Brokers usually set maximum deviation (slippage tolerance) to protect traders from excessive losses during volatile conditions.
In both cases, deviation acts as a warning system. If the market stretches too far from its average, it can signal either potential reversals or strong trend continuation. If execution deviation is too wide, it can harm risk management and trading accuracy.
Deviation in forex trading can be classified into several types depending on how it is measured and applied in practice. Understanding these distinctions helps traders know whether they are analyzing volatility or execution quality.
Price deviation measures how far the current price is from an expected value or a moving average. For example, if EUR/USD trades at 1.1050 while its 20-period SMA is at 1.1030, the price deviation equals 20 pips.
This refers to the level of volatility traders anticipate based on historical data. It helps forecast how much price might swing in upcoming sessions and is often used in backtesting strategies.
Dispersion shows the spread of individual price points around a mean. This is typically calculated using standard deviation, a common tool to assess market volatility.
This is the maximum acceptable difference between the expected trade price and the executed trade price. For instance, if a trader sets a slippage tolerance of 5 pips, but the market moves 10 pips, the order may be rejected or filled at a worse level.
By recognizing these types of deviation, traders can better distinguish between analytical volatility signals and the practical risks of order execution.
Knowing what is deviation in forex helps traders adapt to volatility, refine entries, and manage execution risk. Deviation is not just theory it directly shapes profit consistency and risk control.
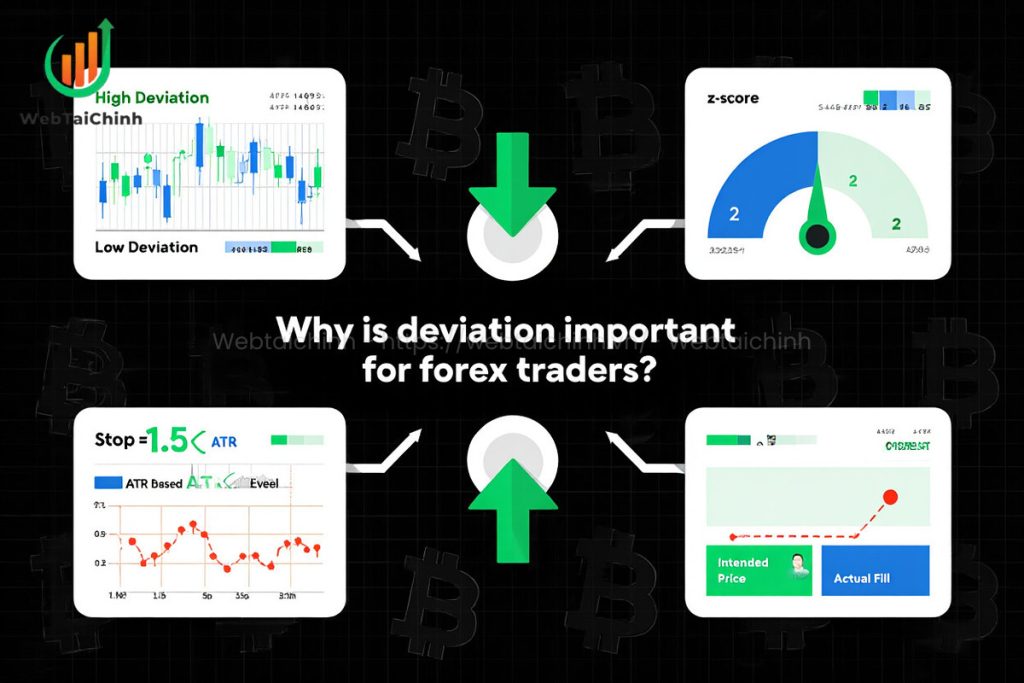
Deviation shows whether the market is calm or turbulent. Low deviation signals range-bound action, while high deviation highlights breakout or trending conditions.
Using z-score or Bollinger Bands, traders can see when price is overstretched. A z-score above 2, for instance, suggests a rare move that may reverse or confirm momentum.
Instead of fixed stops, traders use volatility-based levels (e.g., stop = 1.5× ATR or σ). Position size is then adjusted so risk per trade stays consistent even when volatility shifts.
Deviation also matters in order fills. By setting maximum deviation or slippage tolerance, traders can avoid excessive losses during high volatility or illiquid sessions.
Key takeaway: Deviation acts like a trading compass it shows when to switch from range strategies to breakout tactics, when to widen stops, and how to protect execution quality.
Standard deviation is the most common way traders measure deviation in forex. It shows how far prices move away from their average, giving a statistical view of volatility.
Calculation steps:
Select a period: e.g., 20 closing prices.
Find the mean (μ): average of those prices.
Subtract & square: for each price PiP_i, calculate (Pi−μ)2(P_i – μ)^2.
Average the squared values: sum them up and divide by N.
Square root: the result is the standard deviation (σ).
Example:
If EUR/USD over 20 periods has an average of 1.1000, and most prices stay within ±0.0020, the standard deviation = 20 pips. A higher σ means higher volatility, while a lower σ suggests stable or ranging conditions.
Trading insight:
Shorter periods (10–20) → react faster but may create noise.
Longer periods (50–100) → smoother signals, better for swing traders.
Key takeaway: Standard deviation quantifies market volatility, helping traders decide stop-loss distance, strategy type, and position sizing.
One of the most practical ways to apply what is deviation in forex is by measuring how far price moves away from its moving averages. This shows whether the market is stretched, balanced, or ready for a reversal.
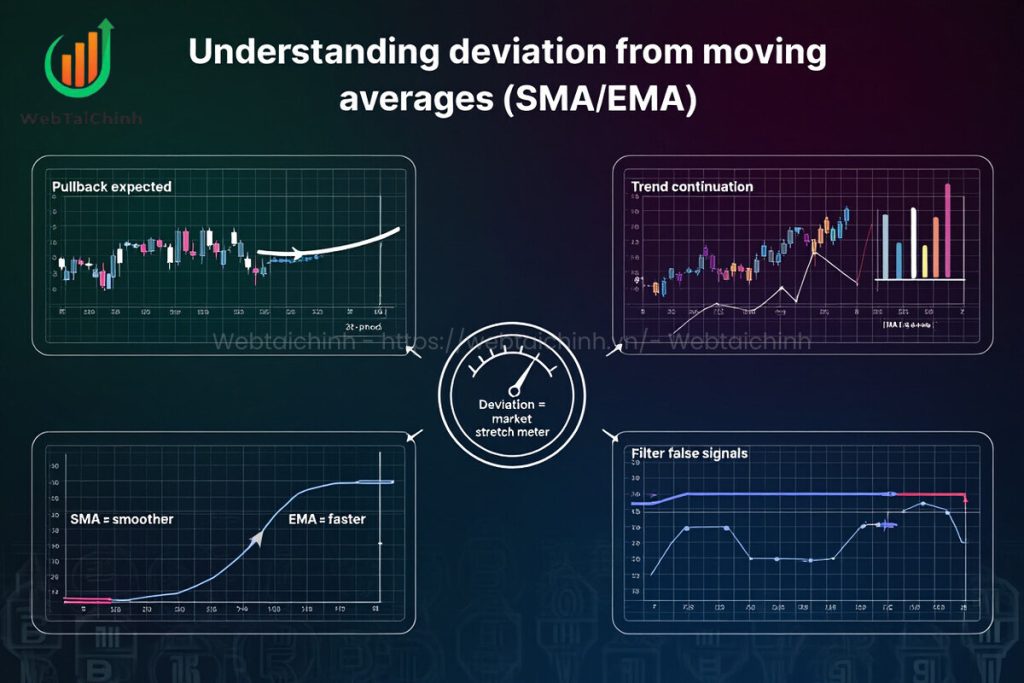
When price deviates too far above or below a Simple Moving Average (SMA) or Exponential Moving Average (EMA), it often snaps back toward the mean. For example, if EUR/USD trades 50 pips above its 20-period SMA, traders may prepare for a pullback.
Sustained deviation from an average is not always a reversal sometimes it confirms a strong breakout or ongoing trend. If price “walks the band” or stays extended from the EMA with rising volume, trend-following setups become stronger.
SMA: treats all past data equally, smoother but slower to react.
EMA: gives more weight to recent prices, faster to signal early moves.
Traders often combine SMA/EMA deviation with ATR (Average True Range) or percentage deviation overlays to filter false signals and better gauge volatility.
Key takeaway: Deviation from moving averages is like a tension meter sharp stretches warn of reversals, while persistent separation signals momentum continuation.
Many of the most popular technical indicators in forex are built directly on deviation. They transform raw volatility into visual signals that traders can use for timing and risk control.
This tool calculates the dispersion of prices around a moving average. A high reading means strong volatility, while a low reading points to consolidation. Traders use it to spot shifts in market regimes and to size positions more accurately.
Bollinger Bands combine a moving average with upper and lower bands set at a multiple of standard deviation (commonly 2σ).
Expansion: Bands widen during volatile periods, hinting at potential breakouts.
Contraction: Bands tighten during calm markets, often preceding explosive moves.
Overbought/Oversold: Price touching outer bands can warn of stretched conditions.
While Bollinger Bands rely on deviation, Keltner Channels use ATR (Average True Range). This makes them smoother, but less sensitive to sudden volatility spikes.
Key takeaway: Both the Standard Deviation indicator and Bollinger Bands translate deviation into actionable trading signals, helping traders detect volatility shifts, overextensions, and breakout setups.
Applying what is deviation in forex effectively means turning volatility signals into structured trading playbooks. Below are three core strategies professional traders use, with practical tools and examples.
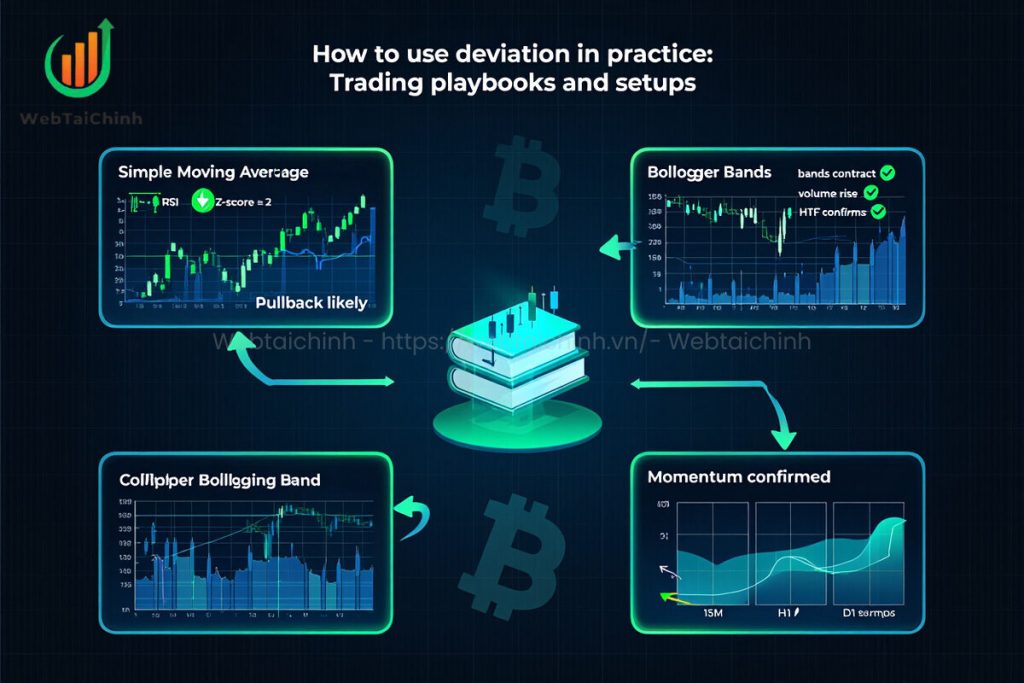
Logic: Price rarely sustains moves far away from its average. When deviation is extreme, a pullback is statistically likely.
Tool: Z-score or Bollinger Bands. A z-score ≥ 2 (price two standard deviations away from its mean) signals an overstretched market.
Example: EUR/USD trades at 1.1050 while its 20-SMA is 1.1000 with σ = 20 pips. A move >40 pips (≈ 2σ) above the SMA suggests mean-reversion.
Checklist:
Price > ±2σ from SMA/EMA.
Oscillator divergence (RSI > 70 or < 30).
Reversal candlestick at support/resistance.
Logic: Low deviation precedes expansion. Tight Bollinger Bands (“squeeze”) often signal an upcoming breakout.
Tool: Bollinger Bandwidth or Standard Deviation indicator.
Example: GBP/JPY 1H chart shows Bandwidth at a 3-month low. A bullish breakout candle closing above the upper band, with volume spike, confirms entry.
Checklist:
Bands contract to narrowest in 1–3 months.
Volume rises on breakout bar.
Higher-timeframe (H4/D1) confirms direction.
Logic: High deviation can confirm momentum rather than mean-reversion. Price “walking the band” shows strong directional flow.
Tool: Bollinger Band trend-following or EMA deviations.
Example: Gold trades steadily above the upper Bollinger Band with ATR expansion. Instead of fading, traders trail stops 1.5×ATR below recent swing lows.
Checklist:
Price holds outside 1σ band for >5 bars.
Volume and momentum confirm move.
Use trailing stop = 1.5×ATR or k×σ.
Aligning deviation signals across timeframes boosts reliability. For example, a 15M breakout works best if the H1 chart also shows rising deviation. This avoids false intraday signals.
Pro tip: Build a “Deviation Playbook” in your trading journal log setup type, volatility state, entry/exit criteria, and outcome. Over time, this data shows which deviation strategy fits your trading style best.
A key reason traders study what is deviation in forex is to strengthen risk management. By linking stop-losses, position size, and leverage to market volatility, deviation turns risk control into a systematic process rather than guesswork.
Logic: When deviation is high, use smaller lot sizes; when it’s low, size up slightly.
Example: Account = $10,000, risk = 1% = $100. Stop distance = 30 pips. Pip value = $10. Position = 0.33 lots.
Checklist:
Risk ≤ 1–2% per trade.
Adjust lot size each time deviation (σ or ATR) changes significantly.
Static stops fail in changing volatility. Instead, base stops on deviation.
Method: Stop = k × σ or ATR (k = 1.5–2.5).
Example: If EUR/USD ATR(14) = 25 pips, stop = 40–50 pips instead of a fixed 20.
Benefit: Reduces premature stop-outs in volatile conditions.
Use multiples of deviation for targets (e.g., TP = 2×ATR).
Trail stops dynamically: move SL = 1.5×ATR below recent swing in a long trend.
Rule of thumb: Cut leverage when deviation > 90th percentile of its 3-month range.
Example: If GBP/JPY deviation doubles during a news release, halve your position or stand aside.
Deviation often spikes abnormally after big economic releases. Professional traders either:
Reduce size, or
Skip the first 5–15 minutes post-news to avoid slippage.
Not all forex pairs or trading styles respond the same way to volatility. To use what is deviation in forex effectively, traders must adapt their indicator settings (periods and multipliers) to the asset and timeframe.
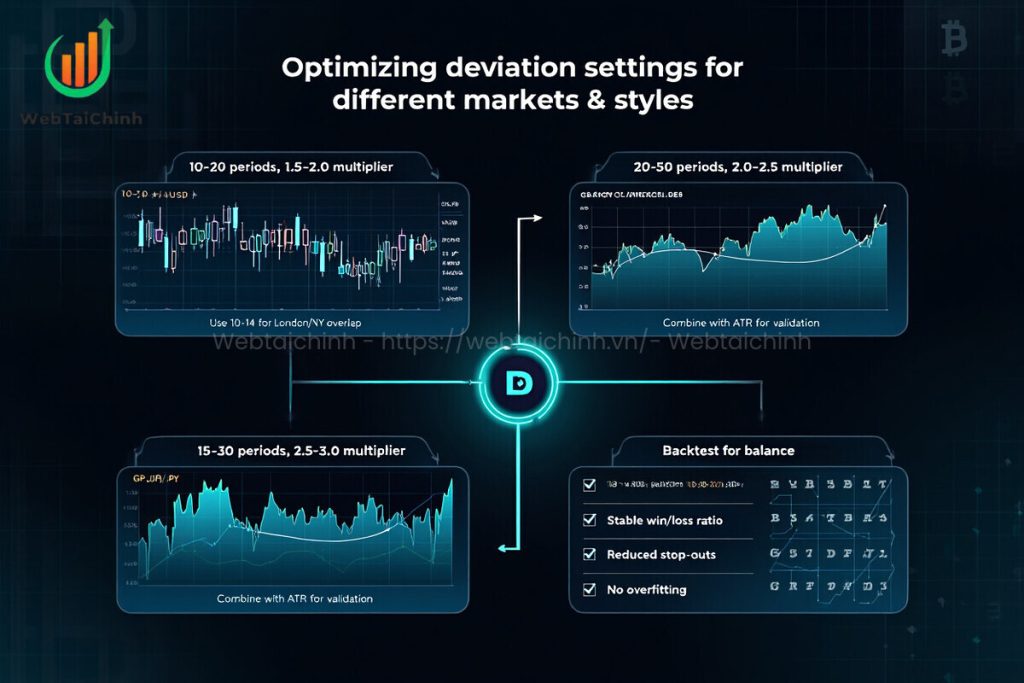
Recommended: 10–20 periods, multiplier 1.5–2.0.
Why: Captures quick intraday swings while filtering noise.
Tip: Use shorter lookbacks (10–14) for London/New York overlap when volatility is high.
Recommended: 20–50 periods, multiplier 2.0–2.5.
Why: Provides smoother signals for multi-day holds.
Tip: Combine with ATR to validate whether breakouts are strong enough to hold overnight.
Recommended: 15–30 periods, multiplier 2.5–3.0.
Why: Higher multipliers filter out false breakouts in choppy, fast-moving markets.
Tip: Backtest different settings to balance early entry vs. false signal avoidance.
Rule: Always test deviation settings on historical data for the specific pair and timeframe you trade.
Checklist before live use:
Average win/loss ratio stable across market cycles.
Stop-outs reduced when adaptive multipliers are applied.
No overfitting works on multiple symbols, not just one pair.
Learn more from our expert resources:
It is the measure of how far price moves from an average or expected value. Traders use it to read volatility and adjust strategies.
Deviation measures market volatility (price spread around an average). Slippage is about execution the difference between the expected trade price and the actual fill.
Adjust them when switching timeframes, assets, or trading styles. For example, volatile pairs like GBP/JPY need higher multipliers than stable pairs like EUR/USD.
Deviation is mostly descriptive it tells you current volatility. However, extreme deviations (very high or very low) often precede reversals or breakouts.
No. Deviation works best when combined with tools like ATR, RSI, or volume analysis. This reduces false signals and improves timing.
Understanding what is deviation in forex is essential for every trader who wants to navigate volatility with confidence. From measuring price stretch to setting adaptive stops and managing slippage, deviation provides a framework for smarter, more consistent decision-making.
Check list – key points covered in this guide:
By mastering deviation, traders can turn volatility into an advantage instead of a threat.
Web Tai Chinh is a portal that updates news and information related to finance quickly and accurately, helping users have an overview before investing, clearly understanding concepts and terms related to Finance. Explore more insights in our Forex category, start your FX trading journey today with the right partner for long-term success.
Contact: 055 937 9204
Email: webtaichinhvnvn@gmail.com
Address: 13 Ho Tung Mau, An Binh, Di An, Binh Duong
What about you do you already use deviation in your forex trading? Share your experience or questions in the comments so we can learn together.