Physical Address
304 North Cardinal St.
Dorchester Center, MA 02124
Physical Address
304 North Cardinal St.
Dorchester Center, MA 02124
In the world of trading, one of the most frequently asked questions by beginners is what is US30 in forex and why it attracts so much attention from both retail and professional traders. Unlike a currency pair, US30 represents the Dow Jones Industrial Average in the form of a CFD, giving traders access to the collective performance of 30 leading U.S. companies.
Understanding its structure, calculation method, and trading dynamics is essential for anyone who wants to diversify beyond forex pairs and explore the opportunities offered by global equity indices.
Key takeaways:
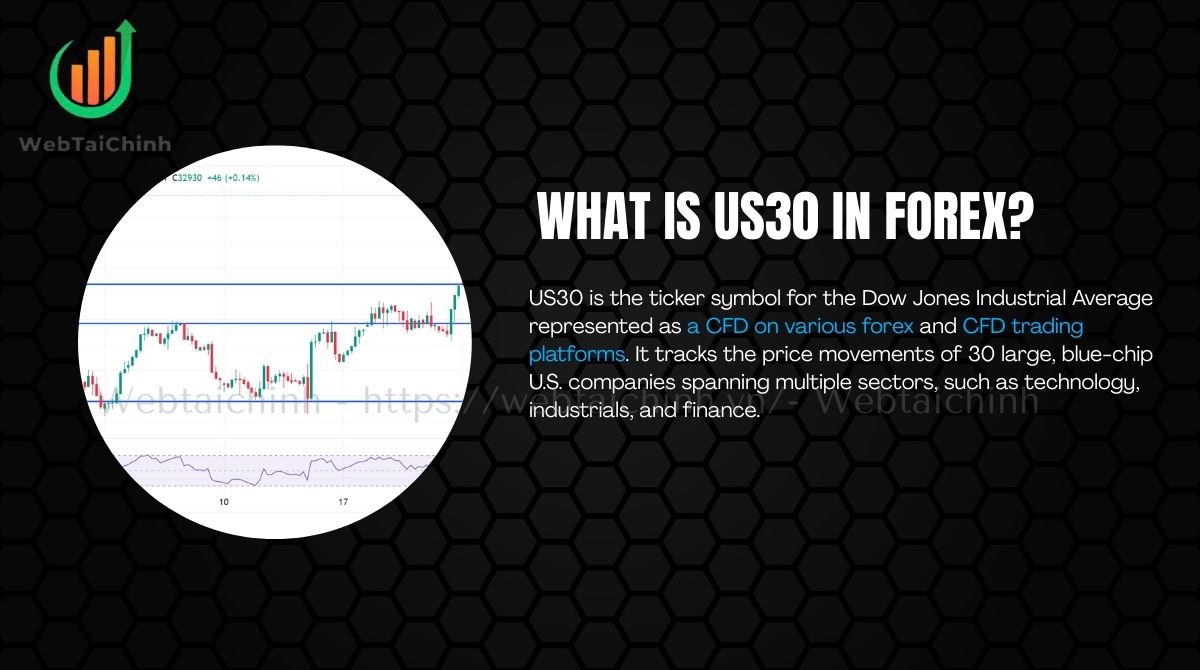
US30 is the ticker symbol for the Dow Jones Industrial Average represented as a CFD on various forex and CFD trading platforms. It tracks the price movements of 30 large, blue-chip U.S. companies spanning multiple sectors, such as technology, industrials, and finance.
Importantly, when trading US30 CFDs, you don’t own the underlying stocks but speculate on the index’s overall price changes. This makes US30 markedly different from currency pairs like EUR/USD, where you trade one currency against another, or ETFs like DIA, which represent actual shares of the Dow 30 companies.
Simply put, US30 is a tradable CFD reflecting the Dow Jones Industrial Average, enabling traders to speculate on the collective price movement of 30 major U.S. companies’ stocks without owning them.
The US30 consists of 30 prominent U.S. companies chosen to reflect the broader economy and various industrial sectors. These include technology innovators like Apple, aerospace leaders such as Boeing, and financial giants like Goldman Sachs.
Instead of weighting companies by market capitalization, the Dow uses a price-weighted methodology, meaning stocks with higher prices have a bigger influence on the index’s movements.
| Company | Sector |
| Apple Inc. | Technology |
| Boeing Co. | Industrials |
| Goldman Sachs | Financials |
| Microsoft Corp. | Technology |
| Johnson & Johnson | Healthcare |
| Visa Inc. | Financials |
| Caterpillar Inc. | Industrials |
| Procter & Gamble | Consumer Goods |
| Walmart Inc. | Consumer Services |
| Chevron Corp. | Energy |
The index undergoes periodic rebalancing and occasional member changes to keep it aligned with the most relevant industry leaders. This dynamic adjustment ensures the US30 remains a current and accurate market indicator. For example, older members can be replaced by emerging companies showing economic prominence, maintaining its representativeness.
The Dow Jones Industrial Average is a price-weighted index, meaning that companies with a higher stock price have a greater effect on the index’s value regardless of the company’s total market size. This differs from market cap-weighted indexes like the S&P 500, where the size of the company influences weight.
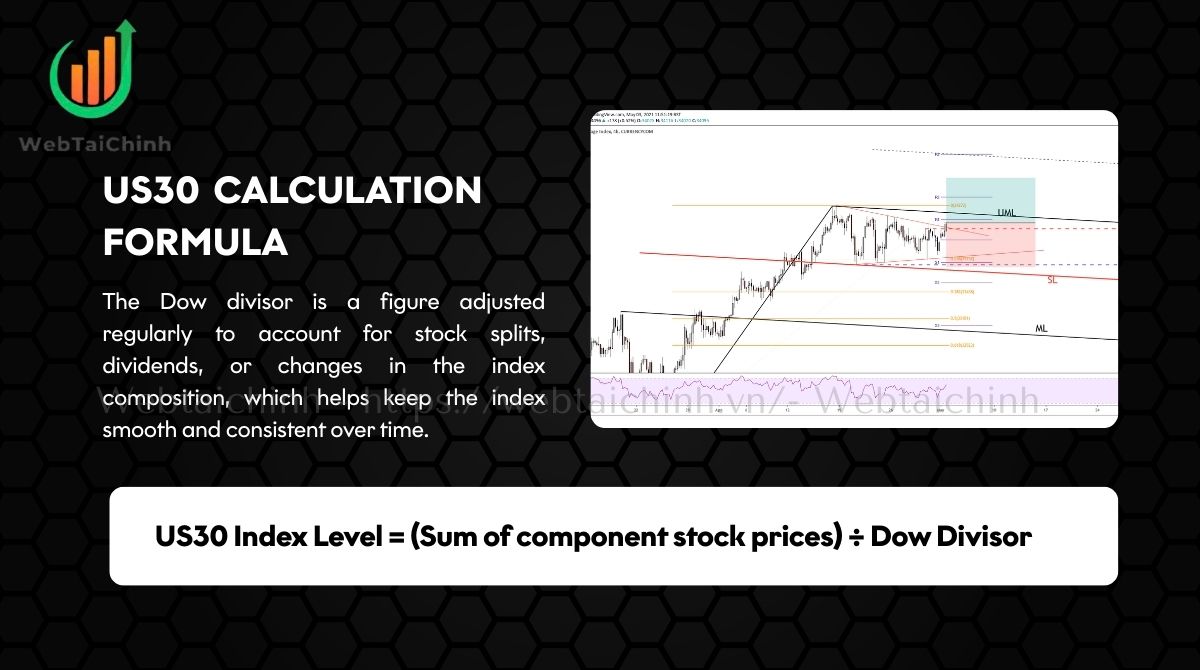
US30 calculation formula:
US30 Index Level = (Sum of component stock prices) ÷ Dow Divisor
The Dow divisor is a figure adjusted regularly to account for stock splits, dividends, or changes in the index composition, which helps keep the index smooth and consistent over time.
Pros: Simple to understand; reflects price changes directly.
Cons: Can overweight high-priced stocks disproportionally; less representative of total market activity.
Trading US30 on forex and CFD platforms is straightforward, designed to offer exposure to the Dow Jones Industrial Average without buying physical stocks. Popular trading platforms like MetaTrader 4/5 (MT4/MT5), TradingView, and cTrader offer US30 CFDs as part of their index instruments.
Example: Opening a 1-lot buy position on US30 when the index is at 35,000 means you speculate on the rise from this level. Closing at 35,500 would realize a profit based on the point difference multiplied by your contract size.
| Specification | Typical Values |
| Minimum lot size | 0.01 lots |
| Spread | 1–3 points |
| Leverage | Up to 1:20 (varies by broker) |
| Trading Hours | 24/5 with US market session peaks |
| Swap Rates | Varies (overnight holding costs) |
Always review your broker’s specific terms to manage costs and risks effectively.
Understanding what moves the US30 index is crucial for traders who want to anticipate volatility and plan smarter entries. Unlike currency pairs driven mainly by interest rate differentials, the US30 reacts strongly to a mix of economic data, central bank actions, corporate earnings, and global events. By recognizing these fundamental drivers, traders can better interpret market sentiment and adjust their strategies in line with the forces that truly shape this index.
For instance, a recent FOMC rate hike announcement triggered a spike in US30 volatility, with Apple and Boeing reporting earnings shortly after to further influence direction. Traders must keep a close watch on the economic calendar and individual stock news for informed decision-making.
Knowing the US30 trading hours, sessions & volatility patterns helps traders identify when liquidity is highest and market moves are most significant. While the index is tradable nearly 24/5 through CFDs, price action differs sharply between pre-market, U.S. open, and after-hours. Understanding these time-based dynamics allows traders to optimize strategies, reduce slippage, and capture opportunities when market activity is at its peak.
| Session | Time (EST) | Volatility |
| Pre-Market | 4:00 AM – 9:30 AM | Low to moderate |
| U.S. Market Open | 9:30 AM – 4:00 PM | Highest liquidity & volatility |
| After Hours | 4:00 PM – 8:00 PM | Reduced liquidity, wider spreads |
US30 trading volume peaks during the official U.S. market hours, especially early in the session and during major economic releases. Comparatively, EUR/USD forex pairs trade nearly 24 hours with different peak times corresponding to European and U.S. sessions. Traders should consider these volatility and liquidity patterns to optimize entry and exit points while minimizing spreads and slippage risks.
Before placing any trade, it’s important to understand the hidden and visible costs that can affect your overall profitability. From spreads and commissions to overnight swaps and slippage during volatile times, each factor can eat into returns if not managed properly. Having a clear picture of these expenses helps traders plan smarter and protect their bottom line.
| Cost type | US30 range | S&P 500 | EUR/USD |
| Spread (Points/Pips) | 1–3 | 0.5–2 | 0.1–0.3 pips |
| Commission | Yes/No varies by broker | Often lower | Usually none |
| Swap | Varies daily | Varies | Typically low |
Minimizing costs involves trading during peak liquidity hours, using limit orders, and selecting brokers with competitive pricing and transparent fee structures.
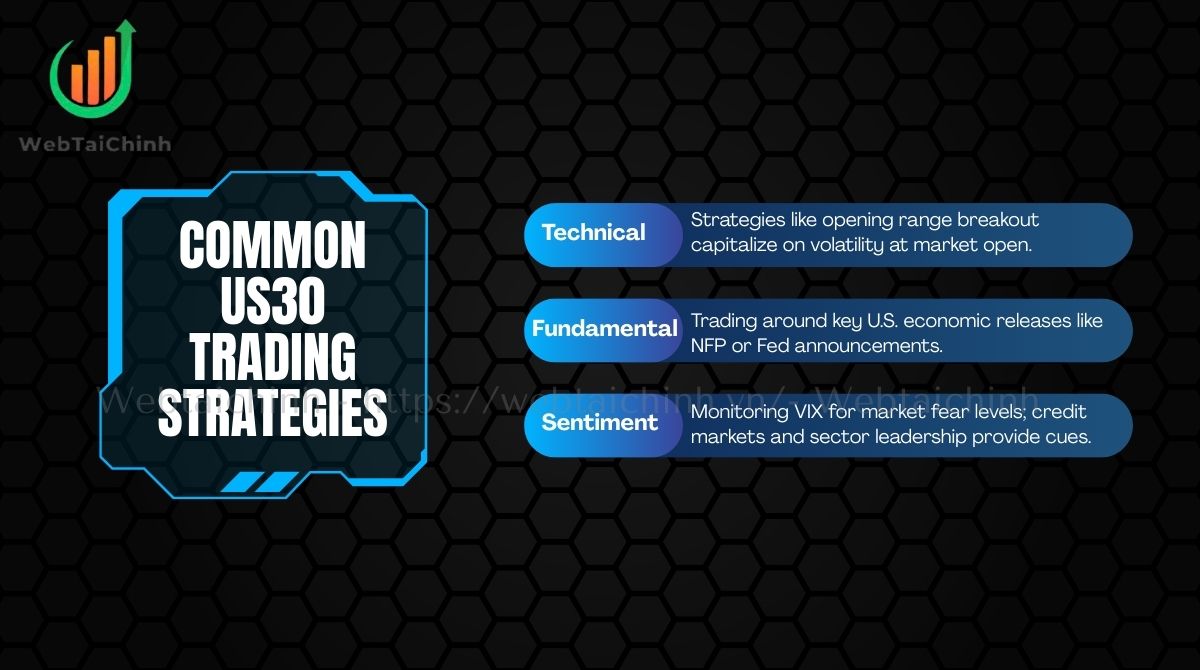
Successful trading requires more than just knowing when the market is open, it’s about applying the right strategies at the right time. Whether relying on technical signals, reacting to fundamental news, or gauging overall market sentiment, traders use a mix of approaches to capture opportunities while managing risk effectively.
Example setup: A trader spots an opening range breakout above the 9:30 AM high and enters a long trade on US30 with a stop loss below the range low and a target based on a 2:1 reward-to-risk ratio. Position sizing is adjusted to risk 1% of the trading account, in line with proper risk management.
The volatile nature and leveraged structure of US30 CFDs necessitate disciplined risk management. Sudden price gaps during major news events and sharp spikes can rapidly amplify losses. Effective strategies include:
For example, if a trader fails to exit before an unexpected Non-Farm Payroll report hits, the overnight gap may trigger stop losses poorly, resulting in significant drawdowns. Such scenarios underscore the importance of preparedness.
When looking at US30 alongside popular forex pairs, it’s clear that each market behaves differently in terms of volatility, trading hours, and key drivers. Comparing these features helps traders decide how to balance their portfolios, manage risk, and spot opportunities across both equity indices and currency markets.
| Feature | US30 | EUR/USD | GBP/USD | Gold (XAU/USD) |
| Volatility | High | Medium | Medium-High | High |
| Trading hours | 24/5 (U.S. times) | 24/5 (Global) | 24/5 (Global) | 24/5 (Global) |
| Major catalysts | U.S. economy, earnings, Fed | Eurozone & U.S. data, ECB/Fed | UK & U.S. data, BOE/Fed | Global risk sentiment, USD strength |
| Cost structure | Spreads + possible commissions | Spreads only | Spreads only | Spreads + swaps |
| Correlation to USD | Typically inverse in risk-on | Direct USD pair | Direct USD pair | Inverse mostly |
For multi-asset traders, US30 provides diversification away from pure currency pairs, but understanding its unique behaviors is essential for integrated portfolio strategies.
Selecting a reliable broker to trade US30 is crucial. Consider the following checklist:
| Broker | Spread | Leverage | Platform | Regulation |
| Broker A | 1.5 points | 1:20 | MT5 | FCA |
| Broker B | 2 points | 1:15 | cTrader | ASIC |
| Broker C | 1 point | 1:10 | MT4 | CySEC |
Testing demo accounts before committing real funds ensures the platform suits your trading style and technical needs.
Read more:
No, it is an equity index CFD representing 30 U.S. companies.
Yes, through regulated CFD brokers worldwide.
US30 is price-weighted and includes 30 companies; S&P 500 is market cap-weighted with 500 companies, NASDAQ focuses on tech-heavy stocks.
No, you only speculate on price movements.
Brokers adjust CFD prices to reflect dividends paid by underlying stocks.
Its price-weighted structure and different constituents cause divergent moves.
Yes, as markets close, price gaps can occur influenced by futures and global events.
Mastering the answer to what is US30 in forex goes beyond knowing it’s just a CFD of the Dow Jones – it’s about recognizing how this index reflects the health of the U.S. economy and how its unique price-weighted structure impacts trading decisions.
For traders, US30 offers both challenges and opportunities, demanding careful strategy, risk management, and a solid grasp of market drivers. By taking the time to understand its mechanics, you not only expand your trading knowledge but also position yourself to trade smarter in a global market where indices like US30 play a pivotal role.
Web Tai Chinh is a portal that updates news and information related to finance quickly and accurately, helping users have an overview before investing, clearly understanding concepts and terms related to Finance. Explore more insights in our Forex category, start your FX trading journey today with the right partner for long-term success.
📞 Contact: 055 937 9204
✉️ Email: webtaichinhvnvn@gmail.com
📍 Address: 13 Ho Tung Mau, An Binh, Di An, Binh Duong