Physical Address
304 North Cardinal St.
Dorchester Center, MA 02124
Physical Address
304 North Cardinal St.
Dorchester Center, MA 02124
What is drawdown in forex and why does it matter to your trading success? Drawdown in forex refers to how much your trading account loses from its peak before recovering, a key measure of risk and capital preservation. Many beginners underestimate drawdowns, leading to blown accounts and emotional mistakes. By understanding its meaning, calculation, and control methods, you can better protect your capital and trade with confidence.
In this guide, Webtaichinh walks you through everything you need to know about drawdowns in forex definitions, formulas, examples, benchmarks, and expert strategies to manage them effectively.
Key takeaways:
To truly understand trading risks, the first question is always: what is drawdown in forex? Drawdown in forex has different angles to understand. Let’s start with its technical definition before moving to formulas and examples.
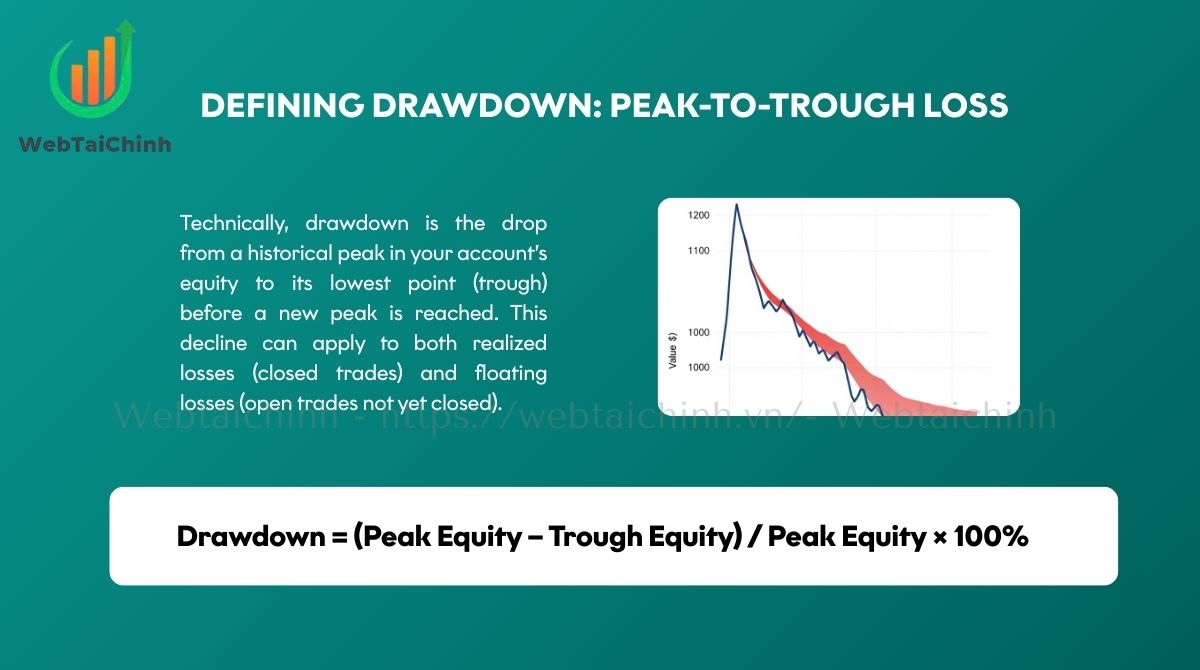
Technically, drawdown is the drop from a historical peak in your account’s equity to its lowest point (trough) before a new peak is reached. This decline can apply to both realized losses (closed trades) and floating losses (open trades not yet closed). A drawdown “ends” when the equity climbs to a new high, but importantly, the maximum drawdown is always known only after the fact because worse losses might occur if trading continues.
Formula for Drawdown:
Drawdown = (Peak Equity − Trough Equity) / Peak Equity × 100%
Visualizing Drawdown: Imagine your equity curve as a mountain range: after climbing a peak, you descend into a valley (drawdown) until you eventually climb higher than before (recovery).
It’s essential to distinguish between account balance and account equity. The balance only reflects closed trades, while equity includes unrealized profits or losses from open positions.
| Type | Account Balance | Account Equity |
|---|---|---|
| Loss Type | Realized Loss (closed trades) | Floating/Unrealized Loss (open trades) |
| Example | Closed losing trades reduce balance to $8,000 | Open trades down $1,200 lower equity to $8,800 |
Most professional traders focus on equity drawdowns since these reflect the real-time risk exposure, especially important for margin and leverage management.
Learn more about what does 100x leverage mean in crypto for context on risk magnification.
Once you know what is drawdown in forex, the next step is learning how to calculate it. To measure drawdown effectively, traders often use two main methods relative and absolute. Each gives a different perspective on losses.
Relative and Absolute Drawdown Formulas
To calculate drawdown, use either relative or absolute methods depending on whether you want a percentage or dollar amount figure.
Relative Drawdown (Percentage):
Drawdown (%) = ((Peak Equity − Trough Equity) / Peak Equity) × 100
Absolute Drawdown (Dollar Amount):
Drawdown ($) = Peak Equity − Trough Equity
For instance, if your account peaks at $10,000 and then drops to $8,000, the absolute drawdown is $2,000, while the relative drawdown is 20%.
Calculation Examples: Step-by-Step
Example 1: Balance Drop
Example 2: Equity/Floating Loss
Such practical examples highlight the importance of monitoring both realized and unrealized losses for accurate risk assessment.
The Recovery Problem: How Much Gain to Break Even?
It’s a common misconception that recovering from a drawdown requires the same percentage gain lost. In reality, recovery gains need to be significantly higher due to the smaller base after the drawdown.
| Drawdown % | Required Gain % to Recover |
|---|---|
| 10% | ~11% |
| 20% | ~25% |
| 30% | ~43% |
| 40% | ~67% |
| 50% | 100% |
This disproportional recovery is a vital reason to limit drawdowns as much as possible to preserve capital and avoid extended recovery periods.
There are several types of drawdown in forex, each highlighting risk in a unique way. Let’s explore them in detail.
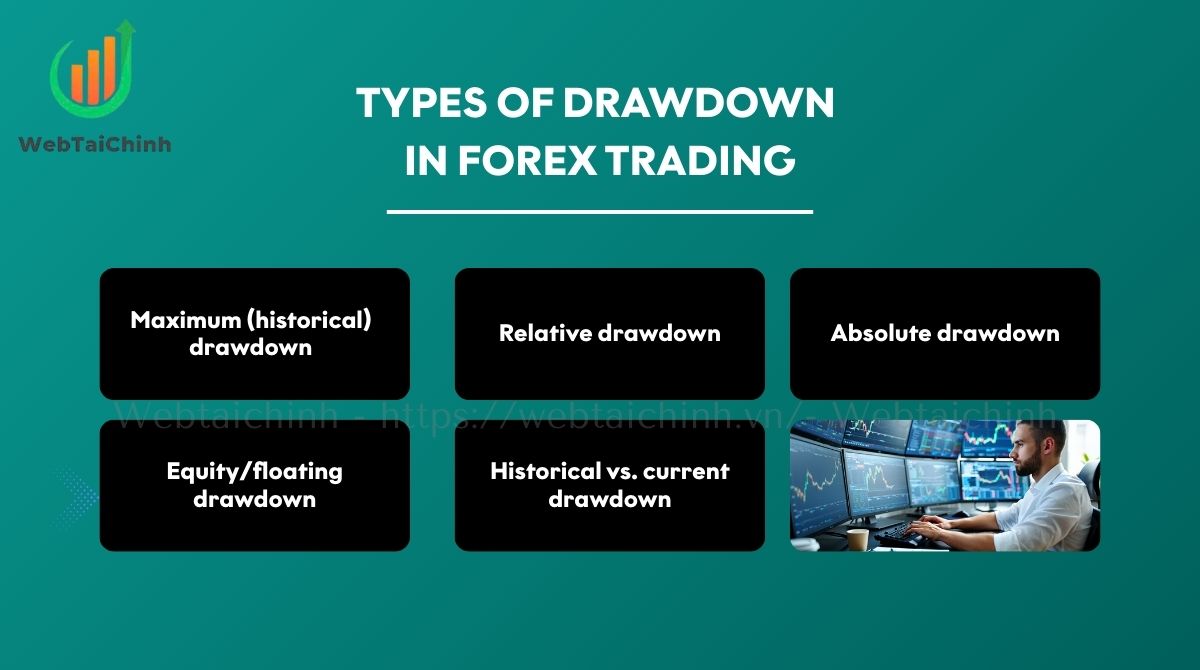
The maximum drawdown represents the largest peak-to-valley loss observed in a strategy’s historical performance.
Pros:
Cons:
For example, a strategy with an 18% max drawdown signals moderate risk exposure that traders must respect when allocating capital.
Relative drawdown expresses loss as a percentage of peak equity, enabling comparison across different account sizes and strategies.
For instance, a 12% relative drawdown in one strategy vs. 30% in another immediately communicates higher risk in the latter.
Absolute drawdown measures the actual dollar loss from the initial capital or peak, appreciated in capital planning.
While it’s useful for seeing real cash risk say a $2,500 loss it does not help as much in comparing performance across accounts or strategies.
This type focuses on unrealized losses. Floating drawdown can be dangerous because it reflects potential losses on open trades that might trigger margin calls if the market moves unfavorably.
Example: An open position down $1,200 lowers your equity but hasn’t been closed yet. If the market worsens, losses could balloon.
This example highlights another dimension of what is drawdown in forex, where unrealized losses play a role in equity risk.
| Drawdown Type | Description |
|---|---|
| Historical Drawdown | Past peak-to-trough losses from equity curve. |
| Current Drawdown | Ongoing loss since the last equity peak. |
Tracking both helps in understanding risk exposure over time and in real-time decision-making.
Beyond numbers, drawdown carries deeper implications on psychology and survival in forex trading.
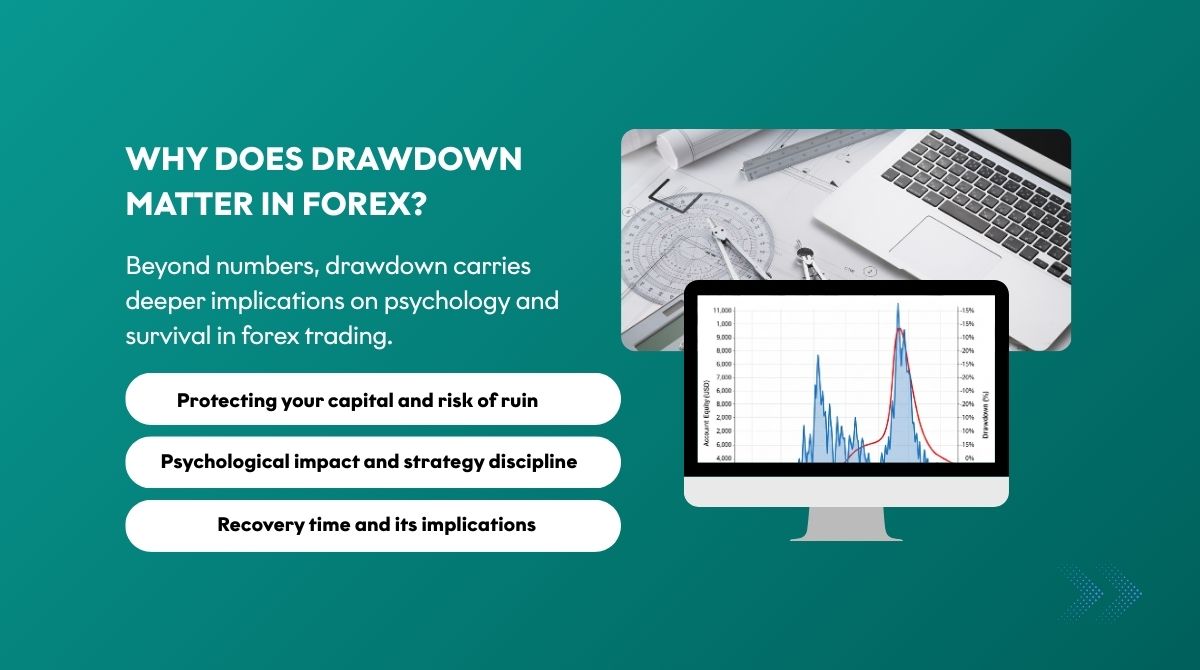
Large drawdowns reduce your capital and increase the likelihood of a risk of ruin where losses are so substantial that recovery is either unlikely or impossible.
Risk of Ruin factors include:
A trader experiencing a 40% drawdown needs to generate a 67% gain just to break even, creating significant psychological and financial strain. Similar to crypto markets, traders often misunderstand recovery math just like misinterpreting what does liquidation mean in crypto.
Drawdowns test traders’ mental fortitude, often leading to common pitfalls such as:
Maintaining discipline during drawdowns is essential to long-term success. Many beginners learn what is drawdown in forex the hard way, losing discipline during drawdown periods
Recovering from drawdowns is not only about percentages but also time. A prolonged recovery period can drain resources and morale.
For instance, a 30% drawdown might take months of consistent profits to overcome, emphasizing the need for realistic position sizing and system selection.
With that context, effective risk management becomes critical to limit downside exposure.
When asking what is drawdown in forex, traders also want to know what is considered ‘good’ or acceptable. Acceptable drawdown levels vary by trading style and individual risk appetite. Here are typical benchmarks:
| Trading Style | Typical Max Drawdown Range | Notes |
|---|---|---|
| Low-Volatility Strategies | 5–10% | Conservative, capital-protective |
| Swing / Position Trading | 10–20% | Moderate risk, longer holding periods |
| Aggressive / Proprietary Trading | 25–35%+ | High risk, requires strong recovery plan |
Align your risk tolerance and trading goals to chosen drawdown limits and backtest results before trading live.
It’s not enough to ask what is drawdown in forex; traders must also know how to reduce and manage it effectively.
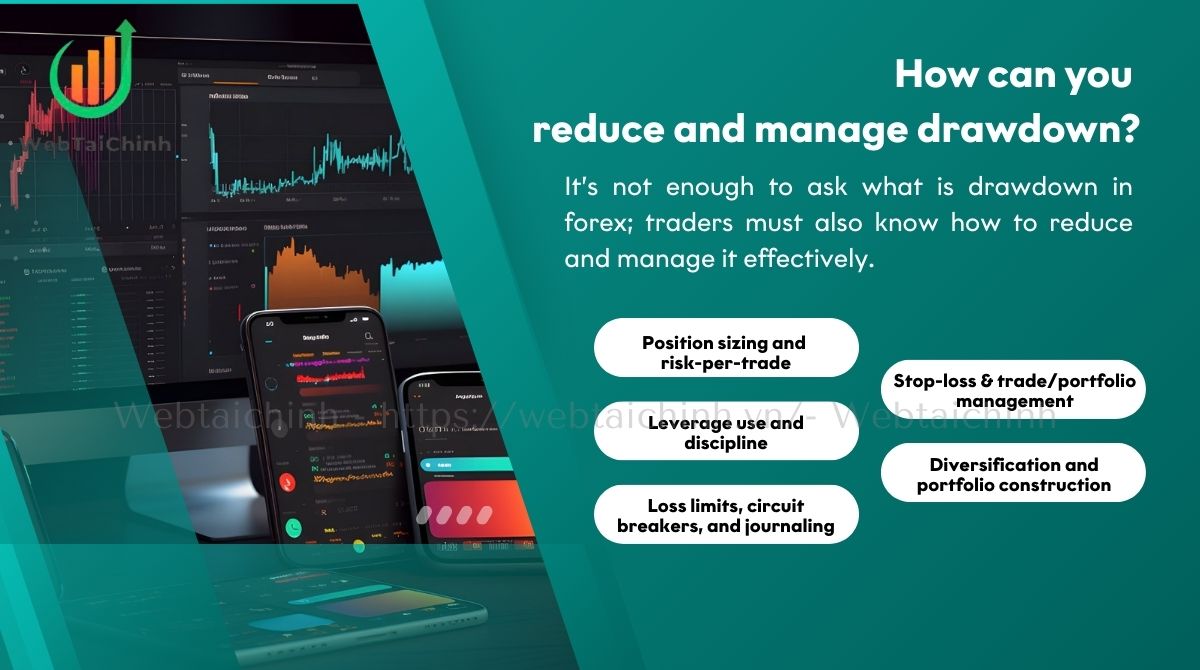
Position Sizing and Risk-per-Trade
Stop-Loss & Trade/Portfolio Management
Leverage Use and Discipline
Diversification and Portfolio Construction
Loss Limits, Circuit Breakers, and Journaling
Structural vs. cyclical drawdowns
Distinguish losses due to a permanently flawed trading system (structural) from normal market fluctuations (cyclical). For example, cyclical drawdowns are natural in trend-following systems during sideways markets, whereas structural drawdowns indicate needed adjustments in strategy.
Key Metrics to Monitor
Monitoring these metrics helps in diagnosing trading performance and risk exposure comprehensively.
Example: Trend-Follower’s 15% Max Drawdown and Recovery
A trend-following trader sees a 15% max drawdown during a market correction. Recognizing the cyclical nature, they refrain from over-trading and hold positions. After two months, the account recovers to new highs, confirming system robustness.
Example: Overleveraged Trader’s 35% Floating Drawdown
An overleveraged trader experiences a 35% floating drawdown due to highly correlated, risky trades. Emotional stress leads to poor decision-making and amplified losses, highlighting the dangers of excessive leverage and lack of risk controls.
Calculator and Python Code Snippet: To calculate and monitor drawdowns efficiently, here’s a simple Python snippet that ingests an equity curve list and outputs maximum and relative drawdowns:
def calculate_drawdown(equity_curve): peak = equity_curve[0] max_drawdown = 0 for equity in equity_curve: if equity > peak: peak = equity drawdown = (peak - equity) / peak if drawdown > max_drawdown: max_drawdown = drawdown return max_drawdown*100 # percent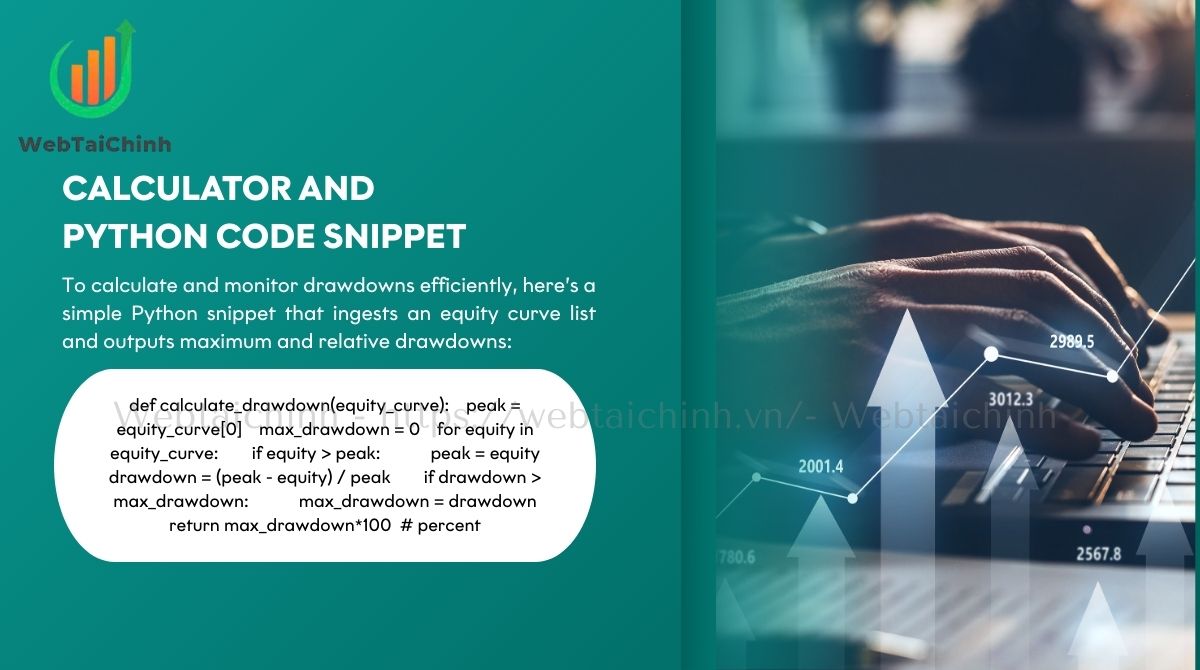
With a few lines of Python, you can calculate what is drawdown in forex in your own trading data. This can be adapted to work with balance or equity data sampled at various intervals for granular risk analysis.
Explore more trading insights:
Drawdown in forex is the decline from the highest point (peak) to the lowest point (trough) of a trading account’s balance or equity, shown as a percentage or dollar amount.
Drawdown is calculated by subtracting the lowest equity from the highest equity, then dividing by the peak equity × 100 for percentage. Example: ($10,000 − $8,000) ÷ $10,000 = 20%.
Maximum drawdown is the largest peak-to-trough loss recorded in an account or strategy’s history. It shows the worst-case capital decline.
A good drawdown depends on trading style. Conservative traders aim for 5–10%, swing traders 10–20%, while aggressive traders may accept 25% or more.
Floating drawdown refers to unrealized losses from open positions. It affects account equity but not balance until trades are closed.
What is drawdown in forex? Drawdown in forex is one of the most important concepts every trader must understand. It represents the decline in your trading account from peak to trough, showing both risk exposure and capital vulnerability. Mastering how to calculate, interpret, and manage drawdowns is essential if you want to preserve capital and achieve long-term success.
Checklist recap:
By applying these principles, you can limit losses, shorten recovery times, and trade forex with more discipline and confidence.
Web Tai Chinh is a portal that updates news and information related to finance quickly and accurately, helping users have an overview before investing, clearly understanding concepts and terms related to Finance. Explore more insights in our Forex category, start your FX trading journey today with the right partner for long-term success.
📞 Contact: 055 937 9204
✉️ Email: webtaichinhvnvn@gmail.com
📍 Address: 13 Ho Tung Mau, An Binh, Di An, Binh Duong
👉 What’s the maximum drawdown level you are comfortable with in your forex trading, and how do you plan to control it? Share your thoughts or questions in the comments so we can discuss together.
What about you how do you currently handle drawdowns in your trading? Share your approach or questions in the comments so we can discuss together.